Cambodia
Country Profile
| Country’s Name | Cambodia |
|---|---|
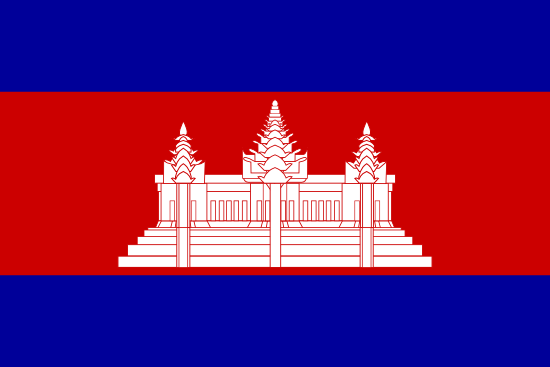
| National Flag |
 |
| Name of Capital City | Phnom Penh |
| Number of Population | 17.03 millions |
| National Language | Khmer |
| National Religion | Buddhism |
| Life Expectancy |
Male: 67.1 years
Female: 72.6 years
|
| Literacy Rate | 84% (2024) |
| Percentage of People Living under the Poverty Line | 16.6% |
| Ethnic Minority Groups | 3.7% (Khmer Leu, Cham, Thai, Vietnam and others) |
| Total Country’s Area | 181,035 sq km |
| Number of Provinces | 24 provinces |
| Seasons/Climate | 2 seasons |
Education Information
Compulsory Education: 9 years (P1 to M3)
Education Level:
| Level of Education | Years of Studying | Age range of students |
|---|---|---|
| Kindergarten | 3 | 3 - 5 |
| Preparatory/Preschool | 3 | 3 - 5 |
| Primary | 6 | 6 - 11 |
| Lower Secondary School | 3 | 12 - 14 |
| High School | 3 | 15 - 17 |
| Vocational School | 1 - 3 | 15 - 17 |
| University (Bachelor’s Degree) | 4 - 7 | 18 - 24 |
School Year (Primary and Secondary)
| First Semester | October 1st - April 4th |
| Second Semester | April 20th- July 30th |
School Break
| First Semester Break | April 5th - April 19th |
| Second Semester Break | August 1st - September 30th |
Enrollment and Dropout Rate
| Level | Percentage of Enrollment Rate | Percentage of Dropout Rate | |
|---|---|---|---|
| Primary Education | 2,142,464 | 8.3 | |
| Secondary Education | Lower Secondary | 541,147 | 21.7 |
| Upper Secondary | 318,165 | 13.7 |
Major Education Issues & Problems
|
1. High drop out rate
|
|
2. Large number of school-going aged populations is outside school (23.56%)
|
|
3. Poor education quality
|
|
4. Lack of teachers in rural areas
|
|
5. Large number of population lives below a poverty line
|
|
6. People’s understanding of education is limited
|
|
7. Closer alignment between education and employment including a development of technical and vocational education and training in response to labor market demands and nationwide skills building is needed
|
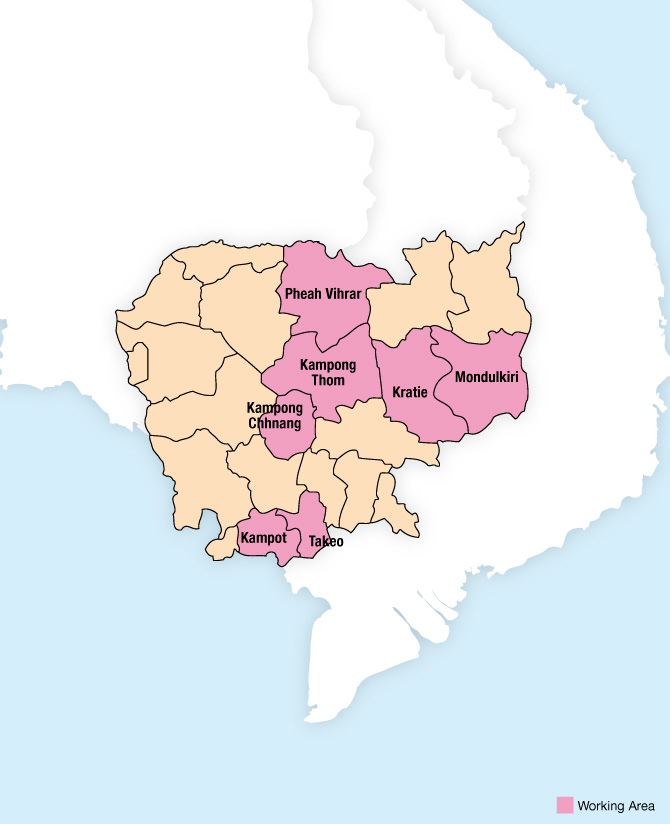
Working Areas
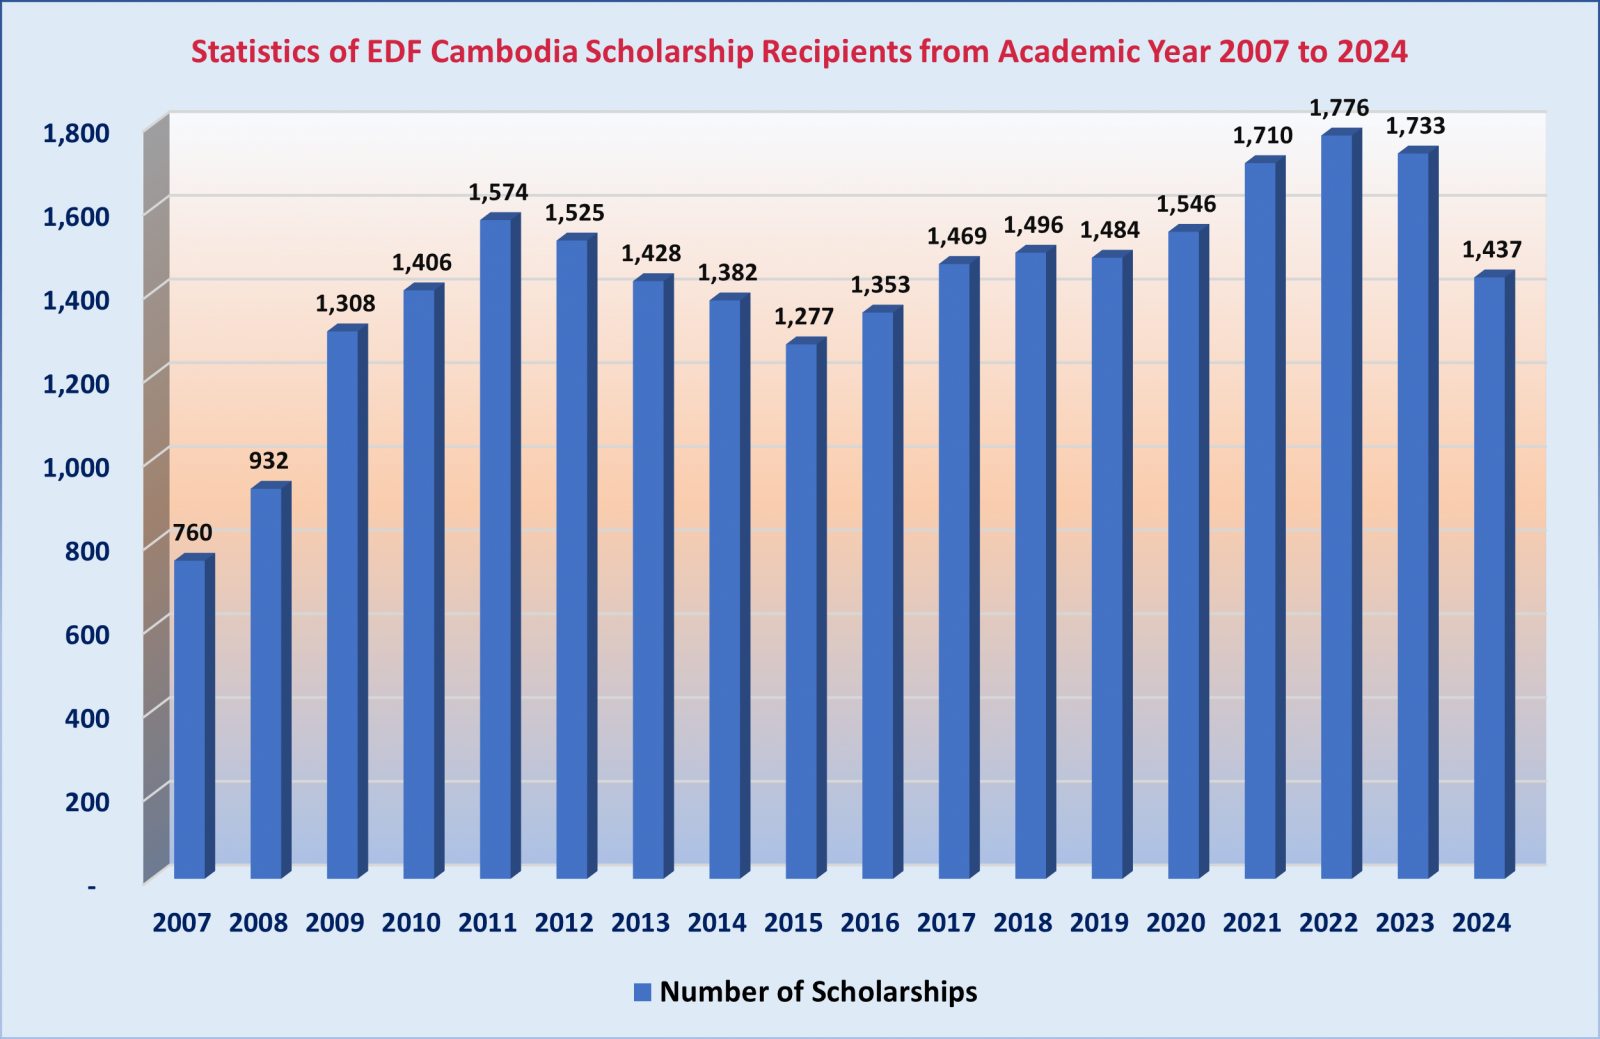
Scholarship Program's Achievements
Pictures tell the truth
Rural student's family in Cambodia
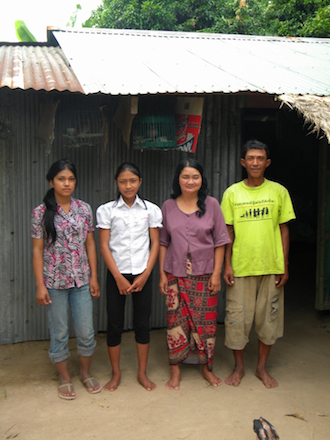 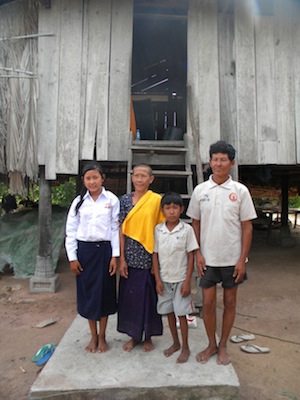 |
Cambodia lower secondary school's classroom
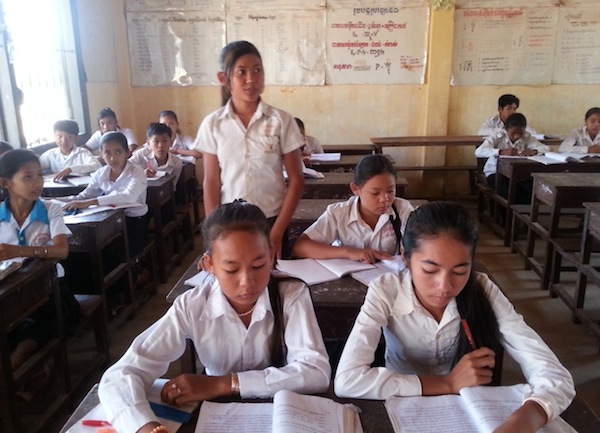
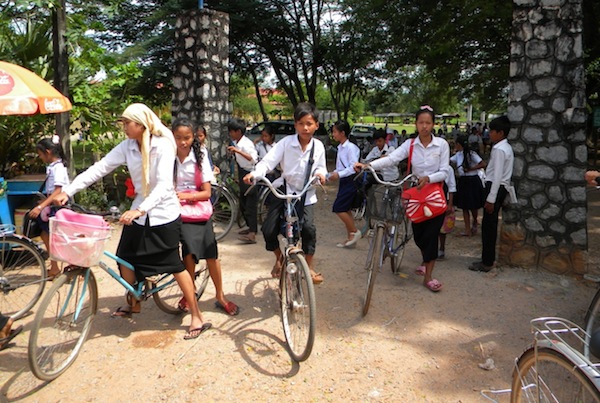
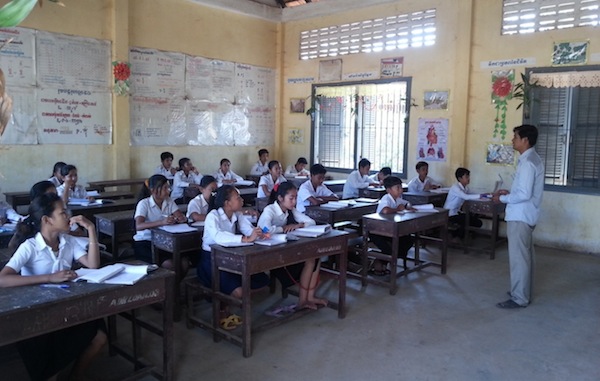 Cambodia's students commuting to school

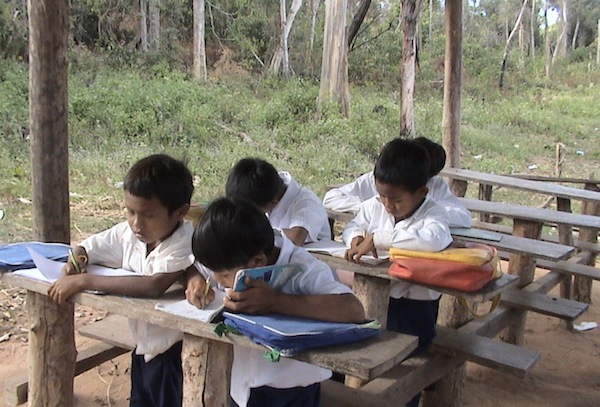
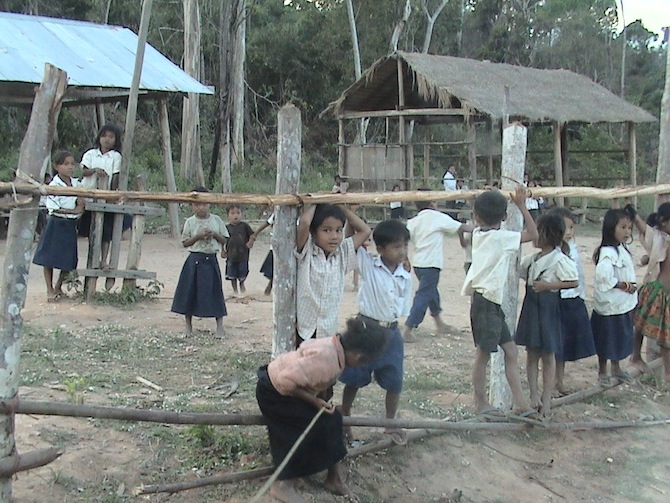
 Cambodia rural school's classroom

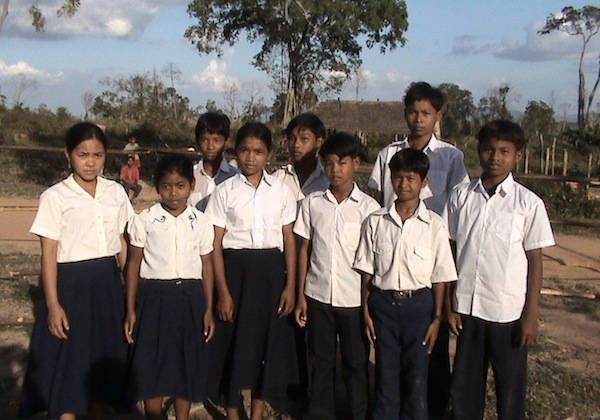
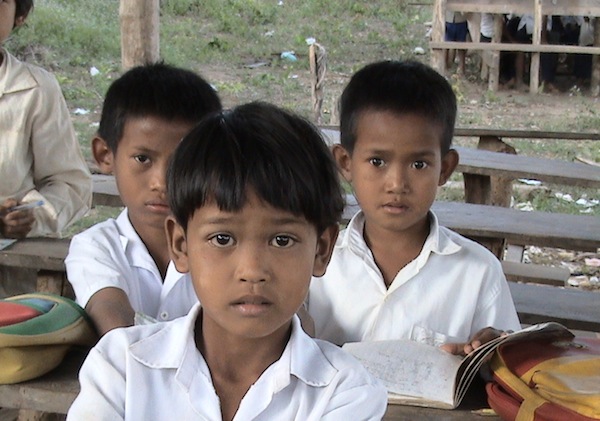 Cambodia students at school

 Cambodia's students commuting to school

 Cambodia rural school's classroom


 Cambodia students at school


THEIR FUTURE IS IN YOUR HANDS
SUPPORT A STUDENT
